Guide
Customer Lifetime Value: Formula, Example, and Useful Limits
Use customer lifetime value to connect repeat purchases with a clear value definition, consistent time periods, and a retention action you can test.
By the Space Office team · Published · Updated · 16 min read
Customer lifetime value is the revenue or profit a business expects from a customer across the relationship. The chosen definition matters: lifetime revenue and lifetime contribution answer different questions. A simple revenue estimate multiplies average order value, purchases per year, and expected relationship years. In Space Office, Gold can prepare retention work and Oxygen can interpret the business choices; Hydrogen coordinates and reviews, and a human approves the data, assumptions, and action.

Key takeaways
- Label the result as revenue, gross profit, or contribution; never compare unlike definitions.
- Use one customer population and consistent time periods for every input.
- Keep historical value separate from a forecast of future purchases.
- Compare cohorts at the same age, and show a range when lifespan is uncertain.
- Turn the calculation into one testable retention decision, with costs and customer experience included.
Download the customer lifetime value worksheet. The worked example uses a fictional shop selling reusable lunch containers and replacement seals. All customers, purchases, costs, and scenarios below are invented teaching inputs. They are not business benchmarks, forecasts, or Space Office customer results.
What customer lifetime value tells you
IBM’s overview distinguishes historical value from predictive value. Historical value describes what a customer has generated so far. Predictive value estimates a broader relationship, including future activity. The distinction matters when a business has many recent customers: a small amount recorded to date may reflect a short observation period rather than a weak relationship.
CLV, CLTV, and LTV are commonly used abbreviations in this context. A label alone does not tell you what was calculated. Two dashboards may both say LTV while one shows gross sales and another subtracts product costs. Put the value definition, population, time basis, and last refresh date beside the number. Those details let a colleague decide whether the result is suitable for the decision at hand.
Scroll horizontally to view all columns.
| Value definition | What it includes | What it cannot establish by itself |
|---|---|---|
| Historical revenue per customer | Recorded eligible revenue divided by the customer population. | Future purchases or the full lifetime of active customers. |
| Estimated lifetime revenue | A model of spending across an assumed relationship. | Profit after product, service, acquisition, and overhead costs. |
| Margin-adjusted lifetime value | Lifetime revenue multiplied by a stated gross margin. | Cash timing or every operating cost. |
| Contribution-based value | Revenue less a defined set of attributable variable costs. | Net company profit unless the definition actually includes all relevant costs. |
A lifetime estimate can help frame a retention project or evaluate the economics of attracting similar customers. It should not replace a cash-flow plan. Revenue expected over several years is not money available today. Equally, an average customer value should not be treated as an exact prediction for a particular person or as a reason to ignore a legitimate service obligation.
Keep related questions in their own scope. The customer acquisition guide explains how a business earns new customers; this guide focuses on the value definition after and across purchases. A net promoter score measures stated willingness to recommend, while CLV uses a monetary model. Feedback can help explain a pattern, but a survey score is not a substitute for purchase and cost records.
Choose a formula that fits the business
For a simple repeat-purchase business, use this revenue estimate: average order value × annual purchase frequency × expected customer lifespan in years. Shopify’s CLV guide documents this structure and its margin-adjusted form. Keep frequency and lifespan on compatible time scales. Monthly purchases need a lifespan measured in months; annual purchases need a lifespan measured in years.
Scroll horizontally to view all columns.
| Input or result | Calculation | Unit |
|---|---|---|
| Average order value | Eligible revenue ÷ eligible orders | Currency per order |
| Annual purchase frequency | Eligible orders ÷ purchasing customers in the same year | Orders per customer per year |
| Estimated lifetime revenue | Order value × annual frequency × assumed years | Currency per customer |
| Margin-adjusted estimate | Estimated lifetime revenue × gross margin as a decimal | Gross profit per customer before costs outside that margin |
The first two terms can be checked together. If revenue, orders, and customers use the same population and period, average order value multiplied by purchase frequency equals revenue per purchasing customer for that period. The order count cancels mathematically. If the two methods disagree in a spreadsheet, investigate filters, rounding, refunds, or mismatched date windows before extending the result into a lifetime forecast.
A subscription business may use a shortcut based on monthly revenue per customer and customer churn. That shortcut depends on stable relationships between churn, revenue, and customer tenure. It becomes fragile with a small cohort, changing pricing, expansion revenue, or a month with no cancellations. A zero observed churn rate does not support infinite lifetime value. Use a cohort view and clearly stated assumptions when the shortcut stops describing the business.
Salesforce’s guide illustrates why cost to serve can change the interpretation of customer value. Decide which costs your version includes and avoid subtracting the same cost twice. If gross margin already removes a particular fulfillment expense, do not remove it again under a second name. Ask the person responsible for the accounts to approve the mapping when the result will inform a real spending decision.
Prepare records and compare the same customer age

Create a short data contract before exporting. Define a customer, an eligible order, the revenue basis, refund treatment, currency, date window, and reporting timezone. A shop with guest checkout needs a documented way to handle repeat buyers without assuming every order is a new customer. Keep only the identifiers needed for reconciliation. Names, contact details, and private notes are unnecessary in the teaching worksheet.
- 1Choose one population, such as customers with a first eligible order in a stated quarter.
- 2Set an equal observation window, such as each customer’s first 12 months.
- 3Reconcile orders and refunds with the approved source system.
- 4Check duplicate records, cancelled orders, test purchases, and currency treatment.
- 5Keep the observation date and unresolved gaps next to the totals.
A cohort is a group sharing a defined starting event or attribute. For the worked method, group buyers by first eligible order and compare them after the same amount of elapsed time. A group observed for 18 months has had more opportunity to buy again than one observed for three months. Comparing their total spending without adjusting the window can manufacture a difference that is simply age.
Shopify’s customer report documentation describes first-order cohorts and intervals since that first order. It also distinguishes recorded results from projections and warns that projections are not guaranteed sales. Use the documentation for your actual source system to understand what its report includes. An attractive chart does not resolve an ambiguous population or time window.
Keep the denominator visible even when someone never orders again. If a first-purchase cohort contains 100 customers, later value per original customer should still use those 100 for that cohort view. Dividing later purchases only by customers who returned answers a different question and can make performance look stronger by removing the people you most need to understand. State which question each table answers.
Check refunds in the same way. A later refund may change the revenue assigned to an earlier order or appear as an event in a later period, depending on the system. Choose and document the treatment rather than quietly mixing both. For the simple arithmetic below, eligible revenue is after refunds and discounts and excludes tax and shipping collected; the fictional cost assumptions are defined separately.
Calculate a worked customer lifetime value example
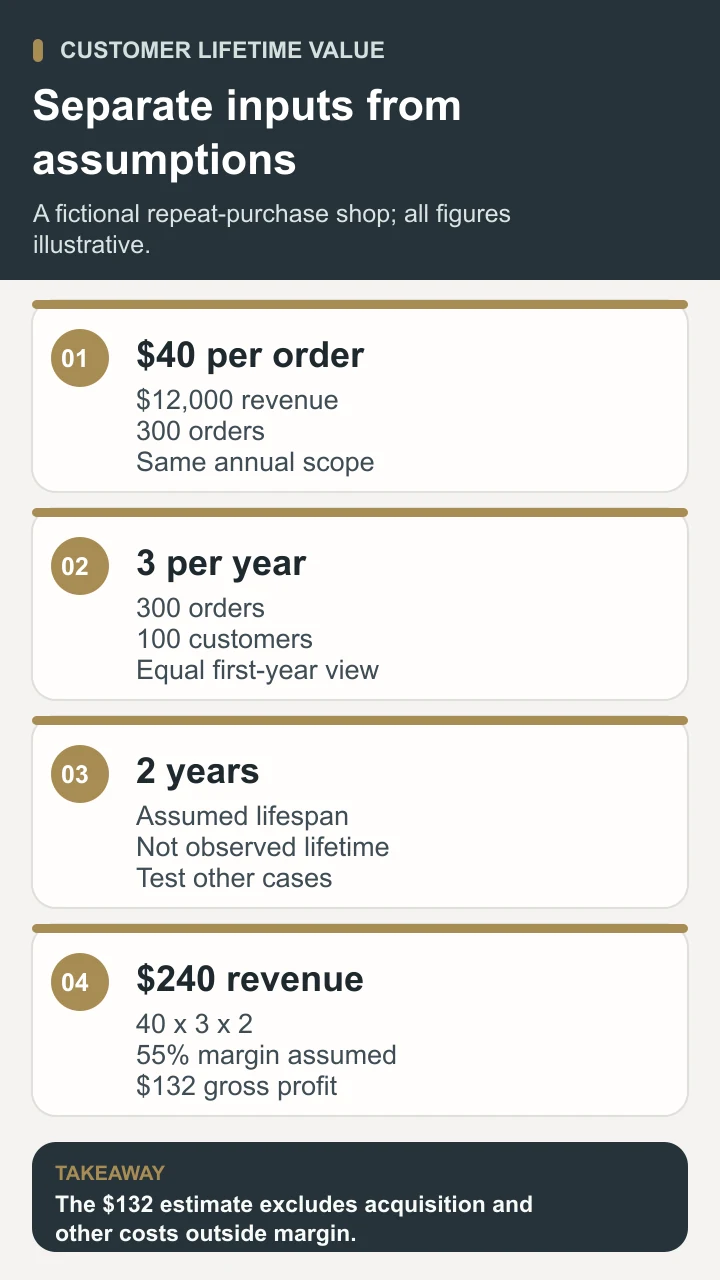
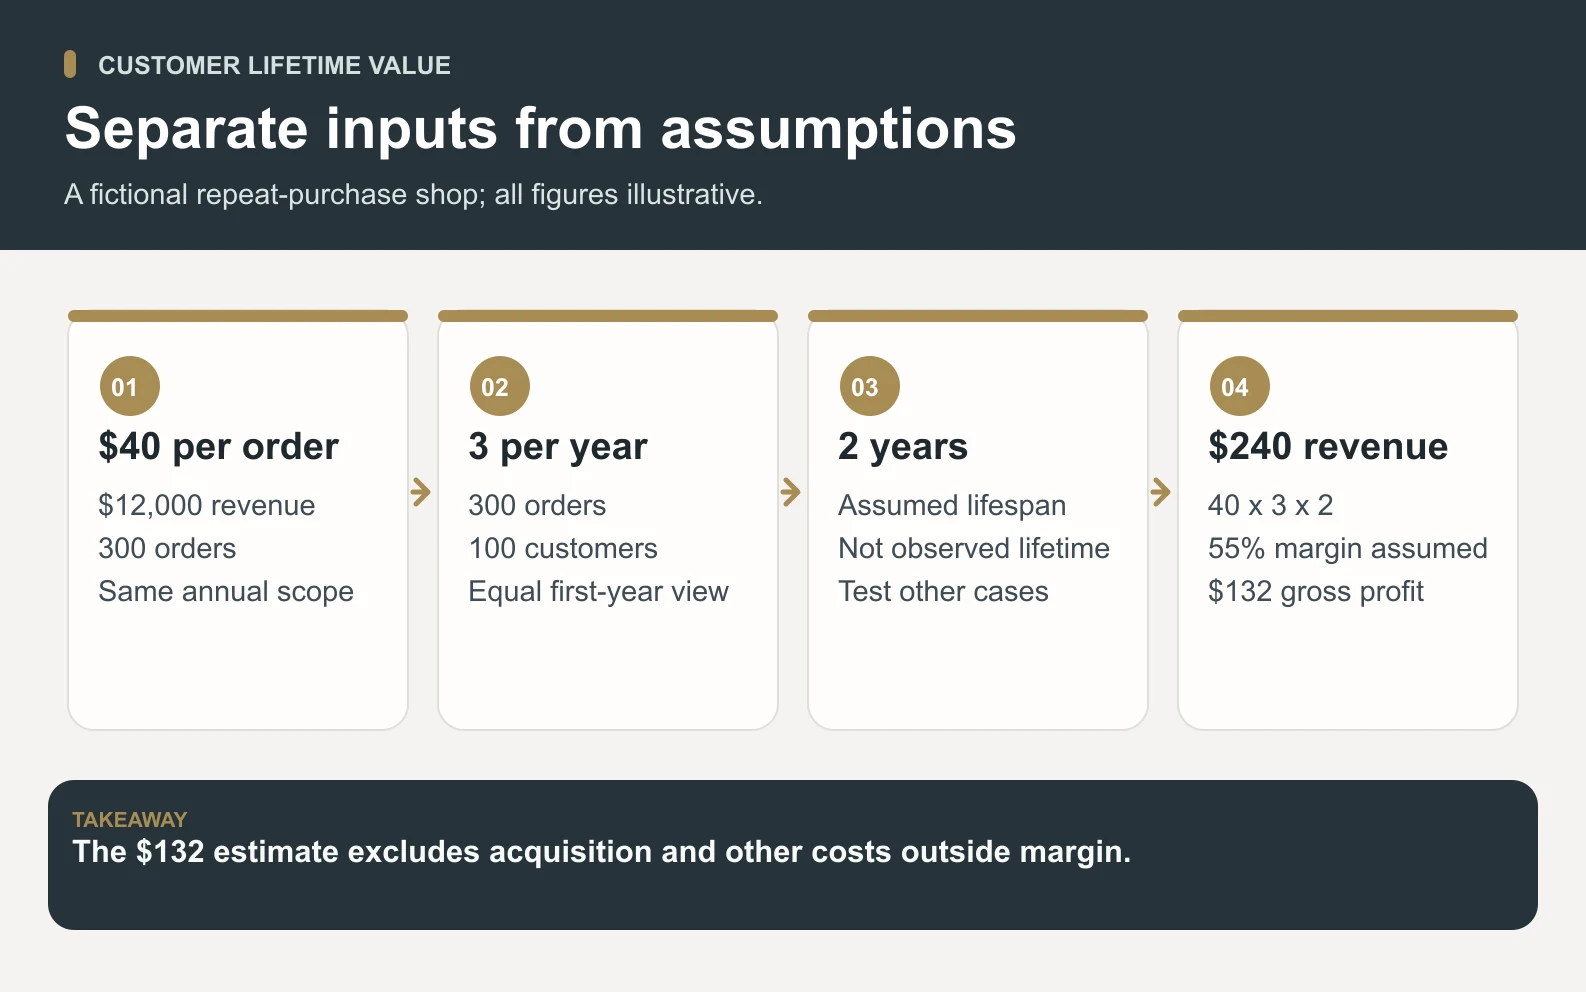
Assume the fictional shop has an equal-window group of 100 customers, 300 eligible orders during their first year, and $12,000 of eligible revenue. That gives $40 per order and three orders per customer in the year. The observed first-year revenue per customer is $120. No lifespan has been measured by those totals alone; the next step deliberately introduces an assumption.
Scroll horizontally to view all columns.
| Step | Fictional calculation | Result |
|---|---|---|
| Average order value | $12,000 ÷ 300 orders | $40 per order |
| Annual purchase frequency | 300 orders ÷ 100 customers | 3 orders per customer per year |
| Observed first-year revenue | $12,000 ÷ 100 customers | $120 per customer |
| Assumed relationship length | Planning assumption, not observed in the first-year totals | 2 years |
| Estimated lifetime revenue | $40 × 3 × 2 | $240 per customer |
| Margin-adjusted estimate | $240 × 0.55 | $132 gross profit per customer |
The arithmetic says that a customer would generate $240 of revenue if the stated annual buying pattern continued for two years. It does not say the shop has already earned $240 from each customer. The $132 result assumes a 55% gross margin throughout that same relationship. It is gross profit before acquisition costs and any other costs excluded from that margin definition.
Now change one input at a time. If the expected relationship is 1.5 years instead of two, estimated revenue is $180 and the margin-adjusted estimate is $99. At 2.5 years, the figures are $300 and $165. These are sensitivity cases, not confidence intervals or probabilities. They show how much the output depends on the lifespan assumption; they do not establish which assumption will occur.
Scroll horizontally to view all columns.
| Assumed years | Revenue at $120 per year | Gross profit at 55% margin |
|---|---|---|
| 1.5 | $180 | $99 |
| 2.0 | $240 | $132 |
| 2.5 | $300 | $165 |
For a separate acquisition comparison, suppose the business spent $4,000 to acquire this same set of 100 customers. The illustrative acquisition cost is $40 per customer. Comparing $132 of modeled gross profit with $40 of acquisition cost gives 3.3. That is not a universal target or evidence that the shop should spend more. The remainder must still cover excluded costs, timing uncertainty, and the risk that the expected relationship does not occur.
The first-year gross profit in this simplified scenario is $66 per customer, from $120 × 0.55. Subtracting $40 of acquisition cost leaves $26 before other excluded expenses. This check makes the time horizon explicit. A model that looks attractive across an assumed lifetime can still create a funding problem if acquisition costs arrive long before repeat purchases. Review cash timing separately rather than reading the ratio as a budget approval.
Turn the number into a retention decision

Suppose the fictional feedback records contain repeated questions about cleaning and replacing the container seal. Gold could organize those approved observations into a retention brief. The proposed action is a clearer care card and a replacement-seal guide for a defined set of new buyers. That is a specific customer problem and deliverable. It is more useful than instructing a team to “increase LTV” without explaining what should change.
Write a test plan before preparing the new material. Name the eligible buyers, the current comparison experience, the new guide, delivery permissions, a review period, and the metric that will inform the decision. Track a practical early signal such as whether customers can find the care answer, plus a later commercial outcome such as repeat purchase within a stated window. One metric cannot replace the other.
Include costs and unwanted effects. If the guide costs $1 per buyer to produce and deliver, 100 buyers create $100 of test cost. In an illustrative scenario where ten incremental replacement orders each contribute $6 after the specified variable costs, the added contribution would be $60. That would be $40 below the test cost before other effects. This is hypothetical arithmetic, not a prediction of ten orders or proof of causation.
A comparison group can help interpret results, but merely having two groups does not make them comparable. Check allocation, timing, product mix, promotions, and sample size. If the guide went only to buyers of a premium bundle, a higher repeat rate might reflect the bundle or buyer differences. Use the A/B testing guide to plan an appropriate controlled experiment; mark results as observational when that is what the design supports.
Avoid using estimated customer value as an automatic service tier. A new buyer has little history, and a purchase record can be incomplete. Build retention work around legitimate needs and agreed service standards. If a customer needs a replacement instruction, a forecast should not become a reason to withhold it. Segmenting a test is a research choice that still requires the business owner to consider the customer experience.
Know where the estimate breaks down
A simple average hides variation. A one-time gift buyer and a repeat buyer replacing parts may have different reasons to return, order sizes, and service requirements. Split groups only when the distinction answers a useful question and leaves enough evidence to interpret. Do not keep slicing a small dataset until one attractive number appears. Write the segment definition before comparing results and preserve the original totals.
A young business may not have enough history to estimate relationship length credibly. In that case, report observed 90-day or 12-month value and a clearly labeled planning range. Longer retention is an assumption until the evidence supports it. An active customer who has not yet left is not a completed relationship, so averaging only completed relationships or current tenure can distort the lifespan input.
Other changes can invalidate a stable-average model: a price increase, product redesign, large promotion, different acquisition channel, seasonal buying, or a new refund policy. Keep model versions so you can distinguish an improved estimate from a real change in behavior. An increase caused by redefining revenue should not be reported as a retention success. Recalculate the old period under the new definition when a fair comparison requires it.
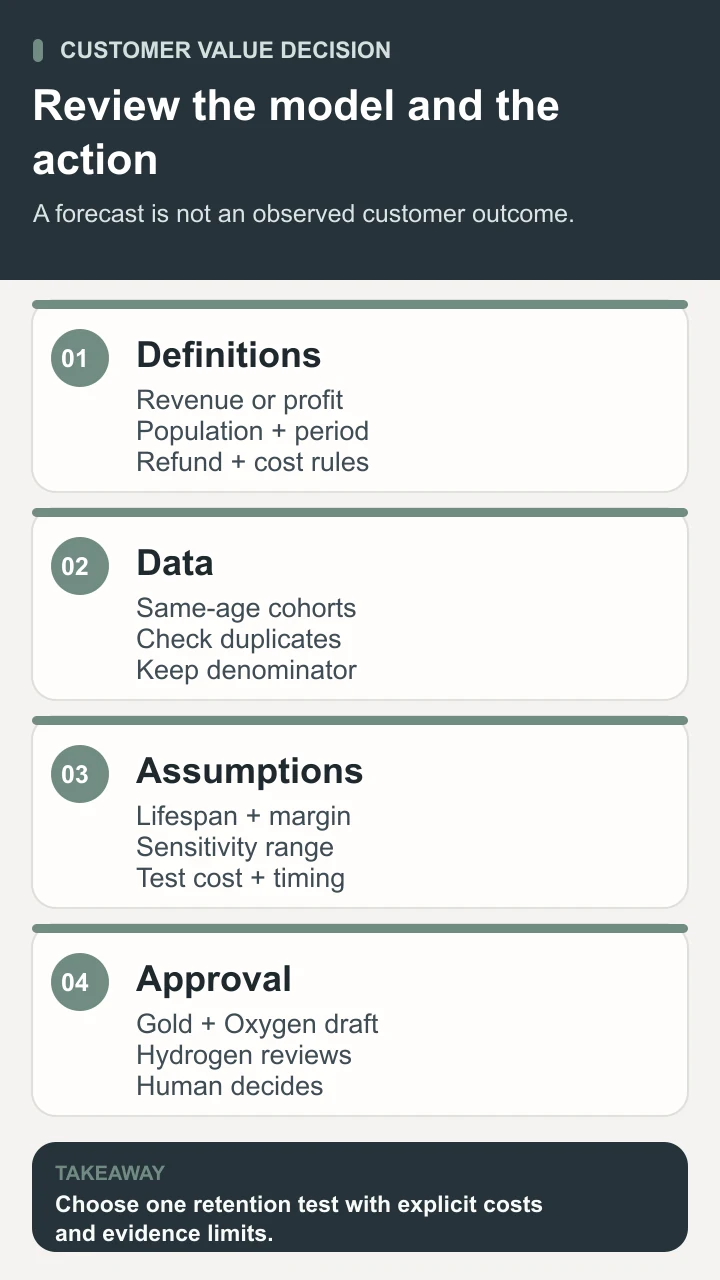
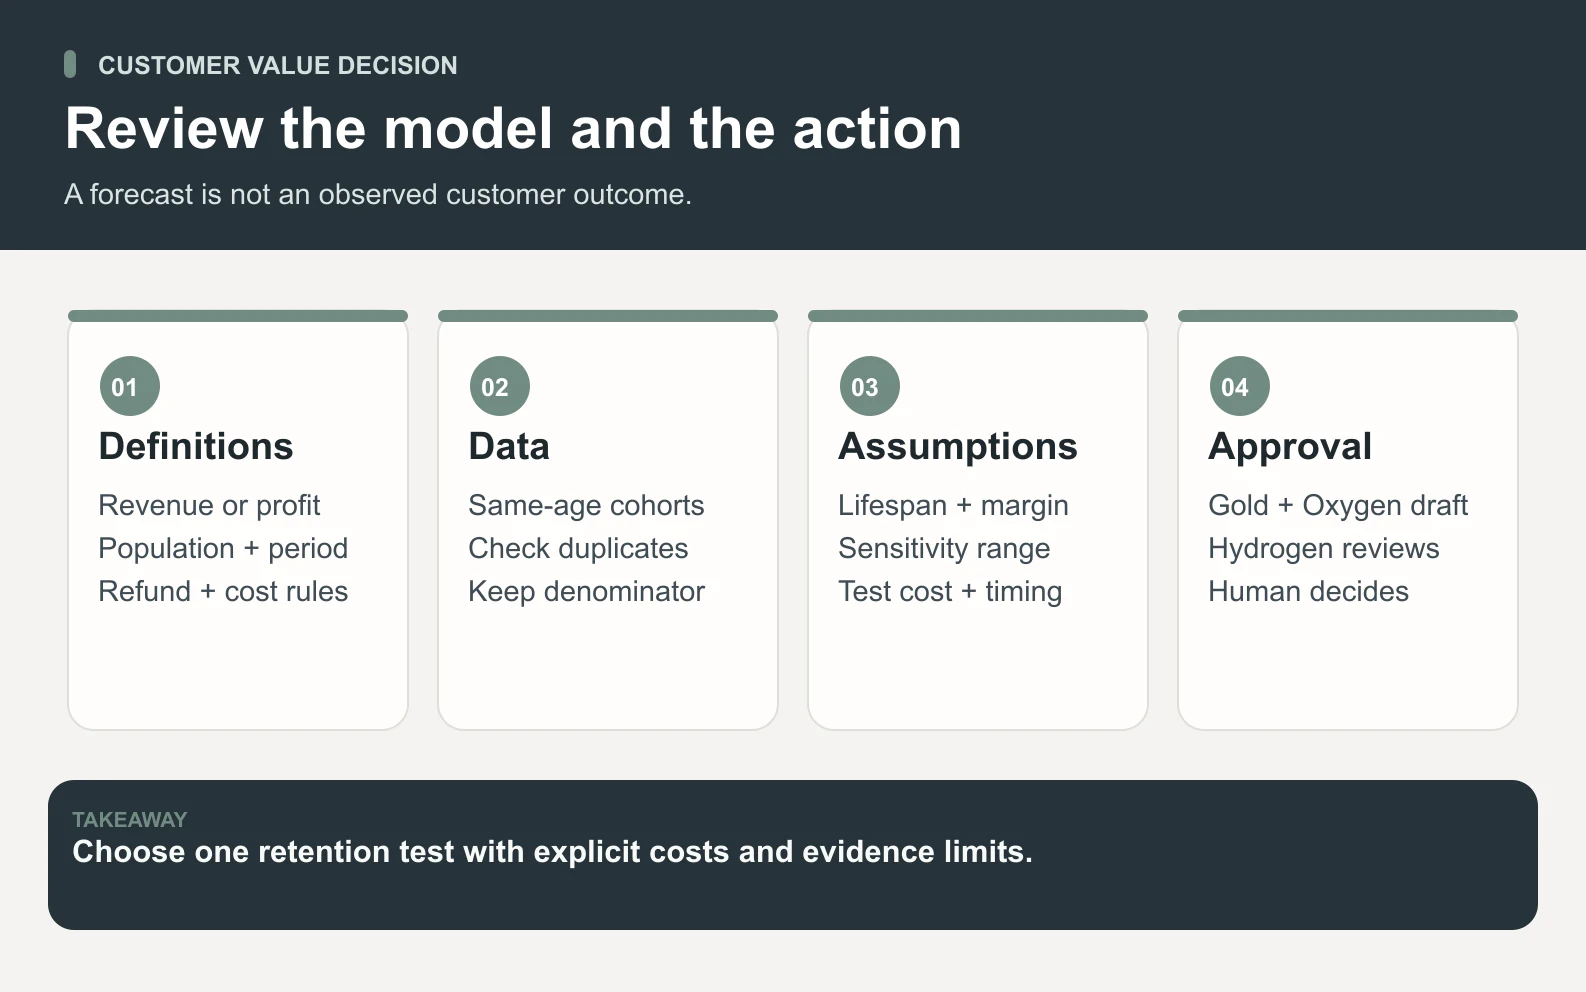
For a bounded Space Office workflow, provide approved aggregate order totals, cohort definitions, documented cost assumptions, and relevant feedback excerpts. Gold can prepare onboarding and retention work; Oxygen can review the business implications and propose a test. Hydrogen coordinates and reviews the packet. A human validates the source records, owns the financial definitions, approves any customer communication, and decides whether to act. Account access and sending are separate explicit decisions.
Ask for a deliverable containing a definitions sheet, reproducible arithmetic, sensitivity cases, unresolved data gaps, and one proposed retention test. If a data extract or technical query is required, scope that work separately with an appropriate live specialist and approved access. Space Office does not acquire transaction data automatically or guarantee repeat purchases. The current roles and workflow overview help you assign the preparation work and review boundary.
Customer lifetime value becomes useful when the team can explain the number and the next decision without hiding the assumptions. Start with consistent observed data, label the value basis, test the arithmetic, and show uncertainty. Then choose one customer problem to investigate and evaluate the cost of the response. Keep the result accountable to real purchases and a human-owned decision rather than treating a forecast as an outcome.
Sources and review notes
Reviewed against the linked primary sources on the checked dates. Search features and citations are selected by their respective platforms; no placement is guaranteed.
- IBM: Customer Lifetime Value — checked
- Shopify: Customer Lifetime Value Calculation — checked
- Shopify Help: Customers Reports — checked
- Salesforce: Customer Lifetime Value — checked
Frequently asked questions
What is customer lifetime value?
Customer lifetime value is the revenue or profit a business expects from a customer across the relationship. State the definition used: a revenue estimate, a gross-profit estimate, and a contribution estimate can produce different numbers. Historical value describes observed activity; predictive value includes assumptions about the future.
What is the simplest customer lifetime value formula?
For a repeat-purchase business, a simple revenue estimate is average order value multiplied by purchase frequency per year and expected relationship years. Use matching populations and time periods. Multiply by a stated gross margin for a margin-adjusted estimate, and label any costs that remain excluded.
What is a good customer lifetime value?
There is no single suitable dollar amount or ratio for every business. Compare the same value definition with the relevant acquisition and service costs, cash timing, and your own observed cohorts. A modeled ratio is a starting point for review, not automatic approval to raise spending.
How do you calculate CLV for a new business?
Begin with observed value over a defined window, such as the first 90 days or year per original cohort customer. Keep that recorded result separate from planning scenarios for future purchases. Show a sensitivity range and the evidence gaps instead of presenting an unobserved lifespan as fact.
How can Space Office help with customer lifetime value work?
With customer-approved data and definitions, Gold can prepare retention and onboarding work and Oxygen can develop the business decision and test proposal. Hydrogen coordinates and reviews. A human verifies the records, arithmetic, cost definitions, permissions, and final action; improved lifetime value is not guaranteed.