Guide
A/B Testing: A Practical Guide, Example, and Free Worksheet
Use A/B testing to compare a specific change with the current experience, with a written hypothesis, reliable measurement, and a decision you can explain.
By the Space Office team · Published · Updated · 17 min read
A/B testing is a randomized comparison of two versions of an experience, usually a current version and one proposed change, measured against a predefined outcome. Start with a hypothesis, assign eligible people consistently to A or B, collect enough valid observations, and evaluate the result using the planned analysis. The larger observed rate alone does not establish a winner. In Space Office, Fluorine can prepare the conversion experiment and Oxygen can connect it to the business goal; Hydrogen coordinates and reviews, while a human approves access, launch, and the final decision.

Key takeaways
- Test one decision with a clear audience, primary outcome, and reason the change might help.
- Plan the baseline, minimum detectable effect, sample requirement, and observation window before launch.
- Check assignment and event quality before interpreting the difference between versions.
- Show counts, absolute differences, relative changes, and uncertainty together; a positive estimate can remain inconclusive.
- If traffic cannot answer the question in a useful time, investigate customer friction and choose a more feasible next step.
Use the conversion rate optimization guide to diagnose the visitor task and decide whether the next action should be a repair, more research, or a controlled experiment.
Download the free A/B testing worksheet to record your hypothesis, metrics, assignment rules, analysis plan, and decision. This guide answers one practical question: how do you run a useful comparison and decide what its result actually supports? The worksheet and fictional example are original working aids; they are not a promise that a particular design change will increase conversions.
What A/B testing can tell you
Suppose visitors hesitate at a consultation form. Your team thinks explaining what happens after submission would make the next step clearer. Version A keeps the existing form. Version B adds a short, accurate explanation beside it. You randomly assign eligible visitors and compare completed submissions. The question concerns that explanation for that audience and setting, rather than whether every shorter or clearer page performs better.
Optimizely's definition describes randomly showing two variants and analyzing their performance against a conversion goal. Random assignment helps separate the effect of the experience from differences in who receives it. Showing A to search visitors and B to newsletter readers would also change the audience, making the comparison harder to interpret.
Keep both groups running during the same period. Comparing last month's old page with this month's new page leaves pricing changes, traffic sources, seasonality, and other events mixed into the result. A before-and-after record can still help monitor a release, but it should be labeled observational. It does not become a randomized experiment because the dashboard has two columns.
Scroll horizontally to view all columns.
| Question | Suitable approach | What to avoid claiming |
|---|---|---|
| Does this explanation change form completion? | Randomly compare the current form and the explanation variant. | That it also improves lead quality unless quality is measured. |
| Why do people misunderstand the form? | Observe relevant users attempting the task and ask about their interpretation. | That a few interviews estimate the size of a conversion lift. |
| Did performance change after our redesign? | Record before-and-after metrics and other changes during the period. | That the redesign alone caused the difference. |
You can compare two complete designs, but the result concerns the whole package. If the headline, pricing explanation, navigation, and form all change, you cannot attribute the outcome to the headline alone. Choose the smallest coherent change that answers the decision you actually face. An obvious broken submission button should be repaired directly and verified; visitors do not need to remain exposed to a known defect to justify fixing it.
Write the hypothesis and fill the experiment worksheet
Begin with evidence of a problem. A support conversation might reveal uncertainty about a consultation's purpose. A recording, collected with appropriate permission, might show repeated form errors. An analytics export might locate a large drop between two defined steps. Record what was observed separately from your explanation. A drop in a funnel says where to investigate; it does not explain the customer's motivation by itself.
A hypothesis you can review
For eligible first-time visitors to our consultation page, adding an accurate explanation of the meeting beside the form will increase completed consultation requests, because visitors can understand the commitment before submitting. We will also check lead quality and submission errors, using the definitions agreed before launch.
Replace each part with your own context. State who qualifies, what changes, which behavior matters, and why the change could affect it. A useful hypothesis can be wrong. If your only explanation is that the new page looks better to the team, investigate the customer task before committing to an expensive experiment. Our customer journey map guide can help organize that investigation.
Scroll horizontally to view all columns.
| Worksheet field | What to record before launch |
|---|---|
| Decision and evidence | The decision owner, observed friction, source dates, hypothesis, and important unknowns. |
| Audience and versions | Eligibility rules, assignment unit, current experience, proposed change, and exposure event. |
| Metrics | One primary outcome, its numerator and denominator, observation window, and guardrails. |
| Analysis | Historical baseline, worthwhile effect, MDE, power, significance level or other method settings, and sample target. |
| Operations | Allocation, expected duration, implementation owner, QA checks, safety stops, and rollback method. |
| Decision record | Data-quality result, estimated effect and uncertainty, practical tradeoffs, approval, and follow-up date. |

Store the approved version of this plan beside the result. Include screenshots of both experiences and the event definitions used at launch. If the team later changes the hypothesis, the record should show when and why. This makes the result useful to someone who was not in the planning meeting and prevents a convenient outcome from quietly becoming the original goal.
Choose metrics, sample size, and a realistic duration
Define the primary metric so two analysts would count the same thing. For a form test, use people with at least one valid submission within seven days of first eligible exposure divided by all assigned eligible people whose seven-day window has completed. Count a person once. State how test accounts, bots, duplicates, and failed submissions are handled, and apply the rules consistently across both groups.
Choose guardrails that represent plausible harm: submission errors, qualified-request rate, or cancellations after a booking. A button-click increase can coexist with worse completed requests. Keep diagnostic metrics separate from the primary decision metric. Looking across dozens of outcomes and announcing whichever improved requires an analysis that addresses multiple comparisons; a long dashboard does not supply that protection automatically.
Statsig's power-analysis documentation connects historical metric behavior, eligible traffic, allocation, minimum detectable effect, and duration. MDE describes the effect the planned test is designed to detect at its chosen power. It is not the result you expect or a promise that an effect of that size exists. Set these inputs before collecting the experimental result.
- Baseline: use a recent, comparable period with the same audience and outcome definition. An all-site purchase rate may be unsuitable for a returning-customer checkout experiment.
- Practical threshold: describe how much improvement would justify implementation, maintenance, and other tradeoffs. Record the business reasoning separately from statistical settings.
- MDE and power: choose a sensitivity you can afford to investigate. Higher power and smaller detectable effects generally require more observations, so check feasibility before building variants.
- Analysis method: specify the method your experiment platform actually uses. Fixed-horizon frequentist, sequential, and Bayesian outputs have different assumptions and decision rules.
- Duration: allow time for enough new eligible units, relevant business cycles, and the full outcome window. Total pageviews are not a substitute for eligible independent participants.
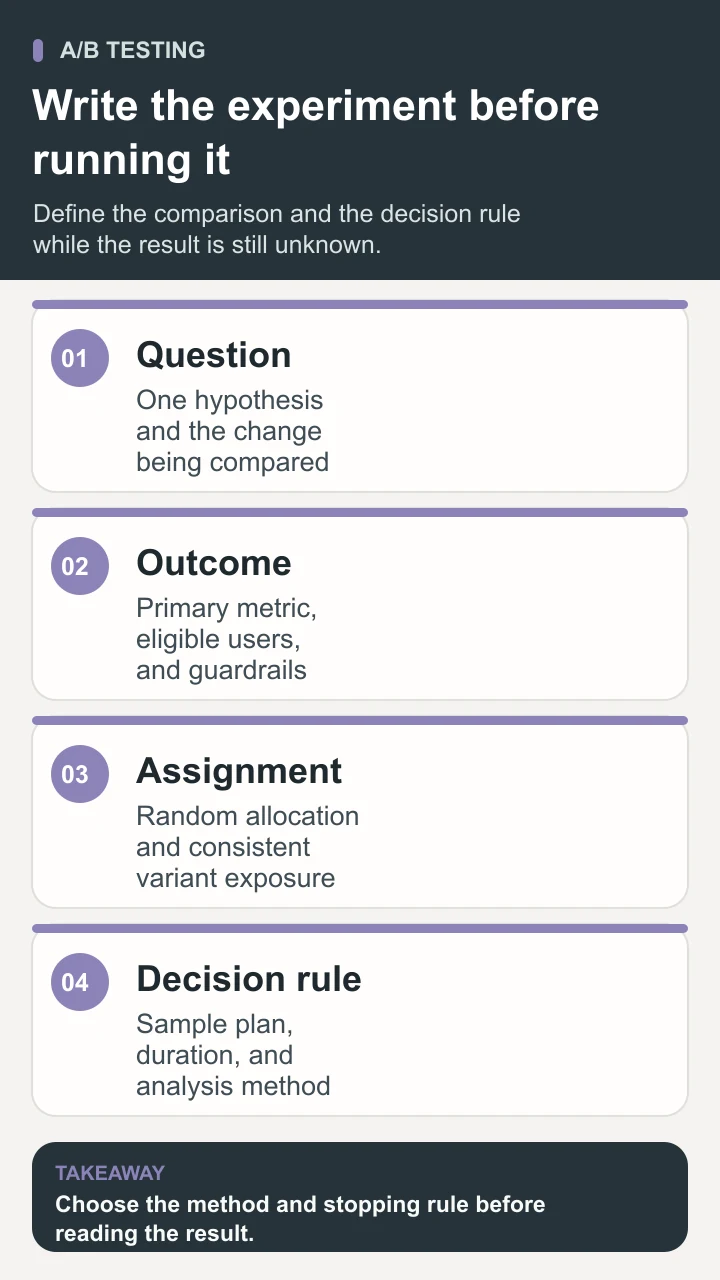
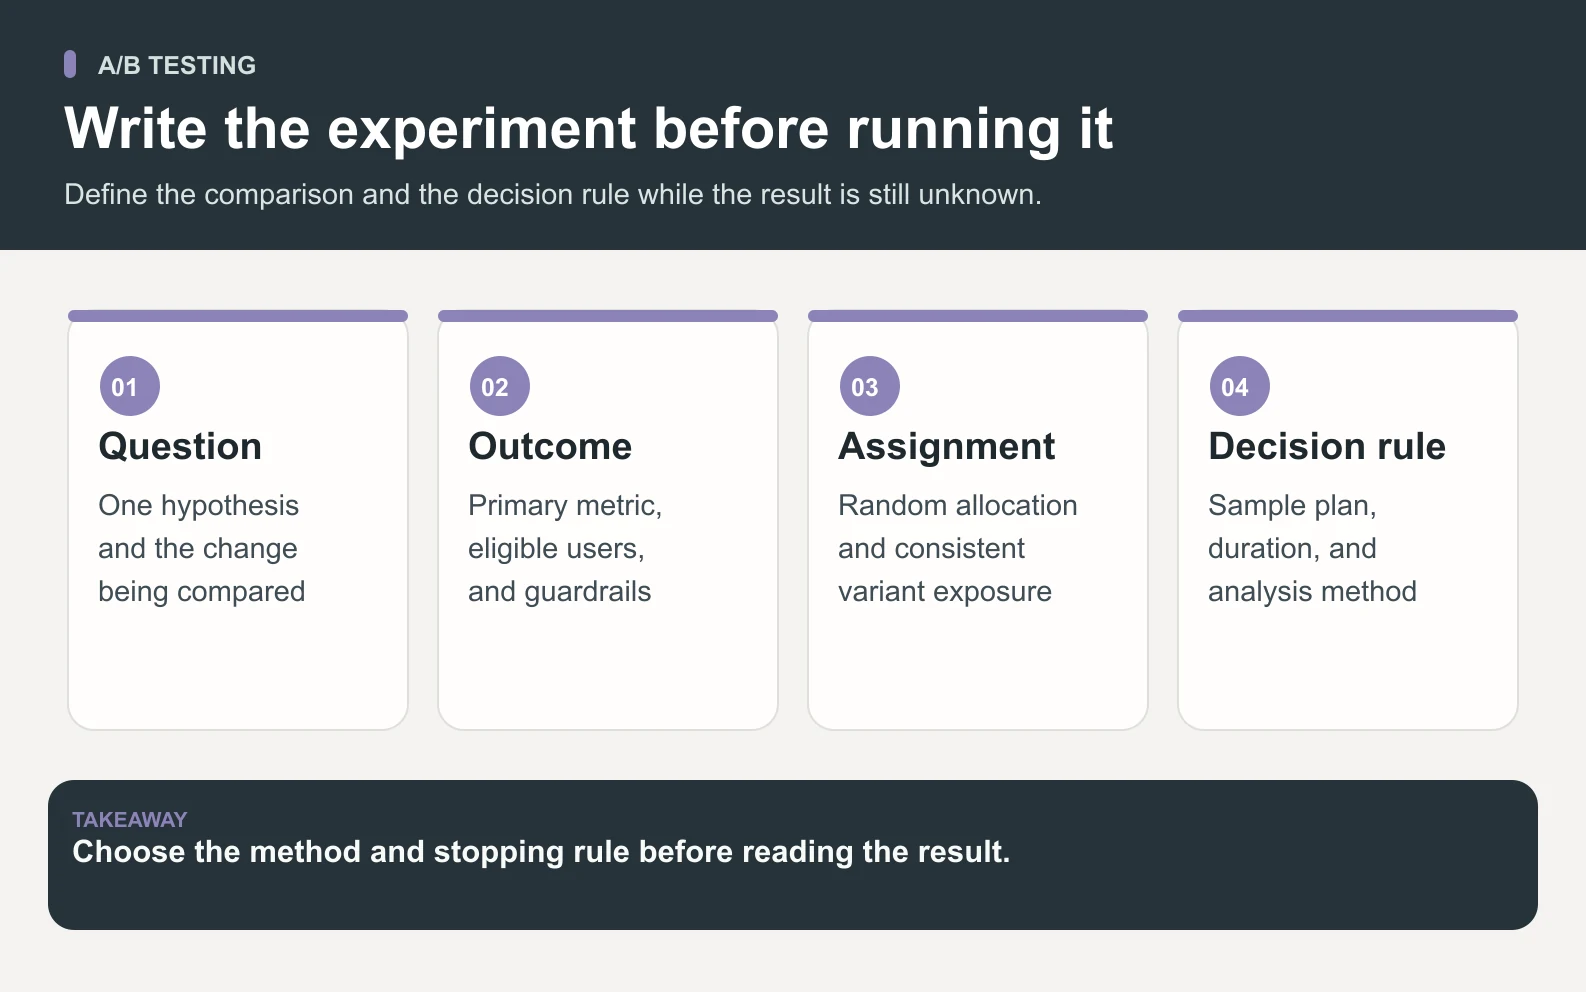
For the fictional example below, the planning baseline is 5% and the MDE is a one-percentage-point increase to 6%, which is a 20% relative increase. A conventional normal approximation for two independent proportions, equal allocation, a two-sided 5% significance level, and 80% power gives roughly 8,200 people per version. The example rounds its target up to 10,000 per version. This is an illustrative calculation; confirm requirements with the actual platform and a qualified analyst when the design differs.
Check the calendar before approving the work. If only 200 new eligible people arrive each week, a target of 20,000 total requires about 100 weeks of enrollment before allowing for delays. That original arithmetic exposes an impractical plan for many page decisions. Use the actual traffic reaching the tested experience, not the company's broader audience, and revisit the question when the waiting time outweighs the value of learning.
Launch a fair comparison and protect the measurement
Choose an assignment unit that matches the experience. For an individual signup flow, a stable user identifier may fit. A shared workspace feature may require assignment at the account level so colleagues do not receive incompatible experiences. Account assignment changes the statistical design; treating every colleague as an independent observation can make uncertainty look smaller than it is. Document the unit and confirm the analysis matches it.
- 1Review the implementation. Check that only the intended experience changes and that both versions work on relevant devices, browsers, and accessibility paths. Confirm the control remains the actual current experience.
- 2Verify assignment. Test eligibility, allocation, stable treatment on return visits, and exclusion rules. Decide how anonymous and logged-in identities interact before measuring results.
- 3Verify events. Complete and fail the task deliberately in both versions. Check exposure timestamps, conversion timestamps, deduplication, and the destination where events are stored.
- 4Approve the launch. Record the owner, approved versions, analysis settings, planned end conditions, guardrails, and rollback path. Confirm the required account access explicitly.
- 5Monitor reliability. Watch errors and instrumentation during the run. Log outages, campaign changes, and other releases that could affect interpretation. Handle serious harm using the agreed safety process.
Compare actual group counts with the intended allocation using the platform's quality check. Microsoft's experimentation guidance describes sample ratio mismatch as an unexpected difference between planned and observed group proportions and says to resolve it before drawing conclusions. Ordinary small differences between random groups are expected; a mismatch warning requires investigation, not manually deleting records until the counts match.
Separate operational monitoring from declaring success. Statsig's sequential-testing documentation explains why repeatedly checking a conventional fixed-horizon result and stopping when it first looks significant increases false positives. Use the stopping rule selected before launch. If early statistical decisions are necessary, choose and configure a suitable sequential method in advance rather than retrofitting a favorable result.
A broken payment path or serious customer impact still calls for action. Stop or roll back under the safety policy, document the reason, and describe the interrupted evidence honestly. You do not need to continue harming users to satisfy a planned sample size. At the same time, an emergency stop does not transform incomplete data into proof that the unbroken alternative improves the primary metric.
Worked example: a form explanation with an uncertain result
Imagine a fictional consultation business testing the explanation from the worksheet. The business, counts, assumptions, and result in this section are invented for teaching; they are not customer results or a Space Office performance benchmark. The experiment uses independent eligible people, equal random assignment, one primary metric, a planned fixed-horizon analysis, and the sample plan described above. Assume implementation and allocation checks passed and every included person's seven-day outcome window completed.
Scroll horizontally to view all columns.
| Measure | A: current form | B: added explanation |
|---|---|---|
| Eligible people with complete observation | 10,000 | 10,000 |
| People with a valid request | 500 | 550 |
| Request rate | 500 ÷ 10,000 = 5% | 550 ÷ 10,000 = 5.5% |
| Absolute difference, B minus A | Reference | +0.5 percentage points |
| Relative change from A | Reference | (5.5% − 5%) ÷ 5% = +10% |
Both +0.5 percentage points and +10% relative change describe the same observed difference. They answer different questions. The first states the change in the rate itself. The second scales it against the control rate. Calling this a 10-percentage-point increase would be incorrect: that would move a 5% rate to 15%, a much larger change. Keep the underlying counts beside the percentages so a reviewer can reproduce them.
Using a simple unadjusted normal approximation for the difference between these independent proportions, the illustrative 95% confidence interval is approximately −0.12 to +1.12 percentage points. The calculation uses the estimated standard error from both groups, then adds and subtracts 1.96 times that error from the observed difference. This interval is an educational calculation, not an output copied from an experiment platform; sequential adjustments or other methods can produce a different interval.
The interval includes zero, a small negative effect, and potentially useful gains. The evidence therefore does not establish a positive effect at this analysis threshold. The planned MDE was one percentage point, while the observed difference is half that size. Designing for the larger effect did not guarantee a precise answer about a smaller one. Report the estimate and uncertainty instead of promoting the larger raw rate to a win.
A decision note could read: 'The explanation version produced a 5.5% observed request rate versus 5.0% for control. The interval remains compatible with no improvement, so we have not established a conversion benefit. Keep the existing version for now, review the customer questions again, and decide whether a revised hypothesis merits another planned experiment.' If the owner chooses the explanation for clarity anyway, record that product judgment separately from the experiment's statistical conclusion.
Interpret the result and choose the next useful step
Read the result in a consistent order: data quality, primary outcome, uncertainty, guardrails, and practical consequences. Statsig's results documentation distinguishes effect estimates and confidence intervals and describes adjustments that depend on the analysis configuration. Confirm which units and adjustments your own report uses. A relative interval and an absolute interval should not be placed in the same column without a label.
Scroll horizontally to view all columns.
| Finding | A defensible next action |
|---|---|
| Assignment or measurement is unreliable | Investigate the defect. Withhold a performance conclusion and determine whether a new run is needed. |
| The planned analysis supports a worthwhile gain and acceptable guardrails | Review implementation and operating costs, approve rollout, and monitor the delivered experience. |
| The primary outcome worsens or an important guardrail fails | Follow the stop or rollback policy and inspect what caused the problem. |
| The result is too uncertain to distinguish useful gain from no gain | Record it as inconclusive. Decide whether another study is worth its cost before collecting more data. |
| The uncertainty range rules out the improvement needed for this decision | Consider ending that line of work and investigating a more promising hypothesis. |
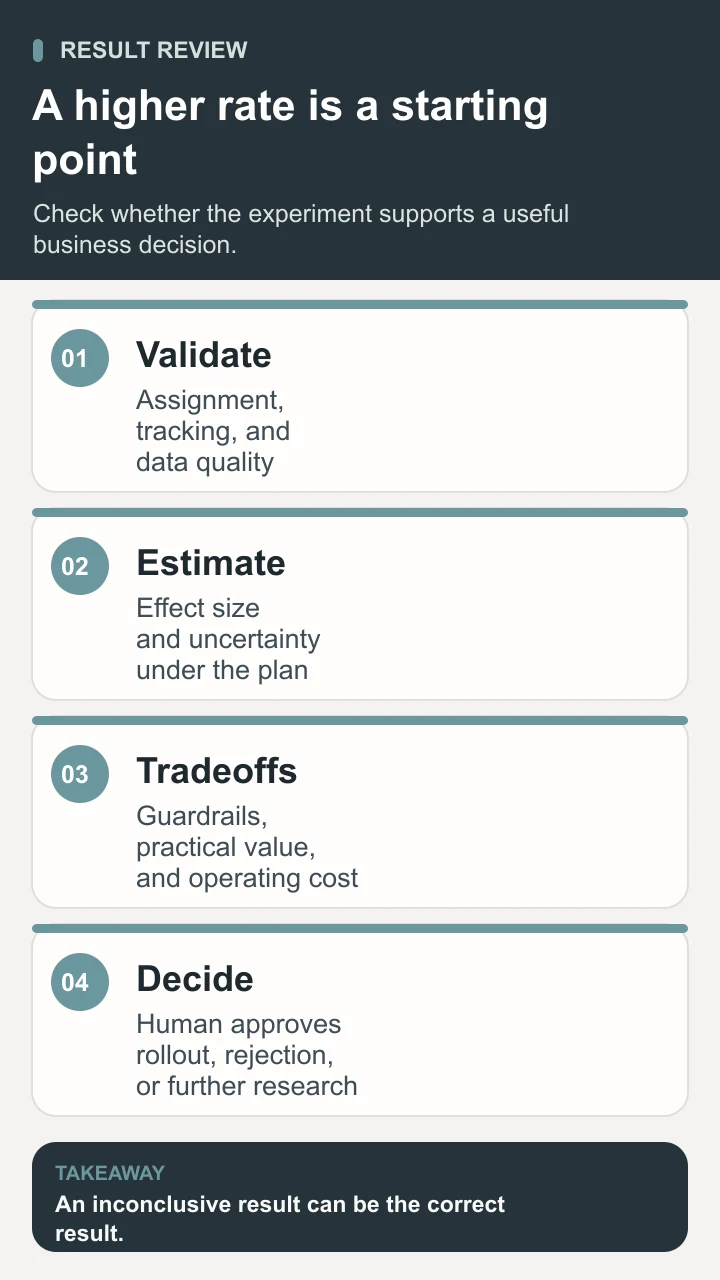
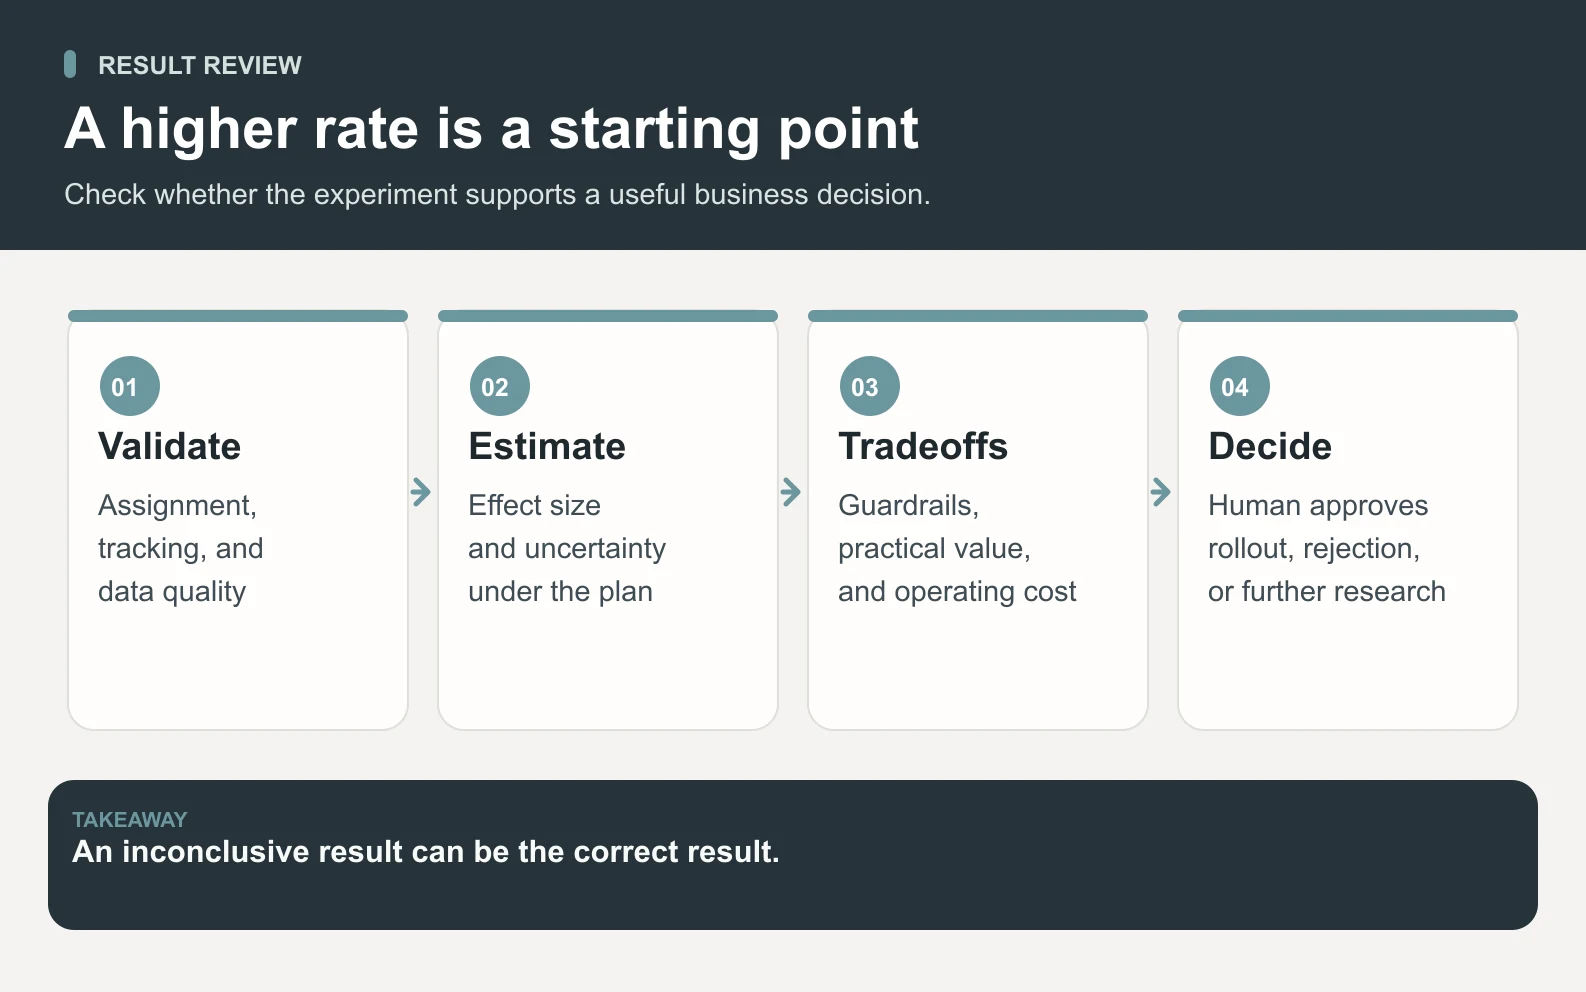
Do not rewrite the audience after seeing the result to create a favorable story. A surprising mobile-only pattern can suggest a follow-up hypothesis, but searching many segments increases the opportunities for chance findings. Preserve exploratory observations in a separate section and test the important ones with an appropriate plan. Similarly, a nonsignificant result does not prove that the two versions are equivalent; that is a different question requiring suitable bounds and design.
When there is too little traffic
Use the feasibility calculation as a decision tool. If the intended comparison would take longer than the offer or page is likely to remain stable, do work that can answer a narrower question sooner. Observe relevant people attempting the task, inspect field validation and error logs, review approved support notes, and verify whether the value and next step are understandable. These methods can identify friction without estimating a causal conversion lift.
Prioritize coherent changes connected to clear customer problems. A larger change may be worth evaluating, but assume neither a larger effect nor a shorter test until you recalculate. You can release a low-risk usability improvement with an owner, rollback plan, and observational monitoring when that is the practical choice. Label the evidence accurately. Switching statistical labels or measuring a convenient click cannot manufacture enough information to answer a purchase question.
Prepare a bounded experiment with Space Office
The live specialist roster identifies Fluorine as the CRO Specialist, covering landing pages, forms, signup flows, analytics tracking, and experiment setup. Oxygen is the Strategy & GTM (CMO) Specialist, with A/B testing programs and analytics among its responsibilities. Use them for a concrete assignment: prepare a reviewable experiment packet for one customer problem, using supplied evidence and an agreed scope.
Provide the current page or screenshots, approved offer facts, customer observations, event definitions, recent eligible-traffic counts, baseline outcomes, platform details, and the person responsible for implementation. Include the constraints: acceptable audience, data-sharing limits, development capacity, commercial commitments, and actions requiring approval. Read-only exports may be enough for planning. A role's listed toolset does not mean it already has access to your analytics or experimentation accounts.
- 1Oxygen connects the proposed change to the business decision, clarifies which outcome would matter, and records assumptions the supplied evidence cannot settle.
- 2Fluorine reviews the conversion path and prepares the hypothesis, variant specification, measurement checklist, and setup requirements. Missing event definitions or uncertain access stay visible.
- 3Hydrogen coordinates the handoff and reviews the packet for consistency with the brief, unsupported claims, incomplete inputs, and decisions needing a person.
- 4The human owner and responsible analyst or engineer verify statistical settings, instrumentation, feasibility, and permissions. The human approves launch and later decides whether to release, revise, or retain the current experience.

Set an acceptance standard for the packet: someone should be able to reproduce the metric definitions, identify both versions, locate the source data, and explain the planned stopping and approval rules. Use the AI-team briefing guide for the handoff format. The coordination workflow explains the review process. Implementation, account changes, and publication require the relevant access and authorization; preparation alone does not launch an experiment.
Finish A/B testing with a decision you can defend
A/B testing is useful when a fair comparison can reduce uncertainty about a real decision. Start with the customer problem, write the experiment plan, and check that your traffic and instrumentation can support it. Afterward, retain the counts, definitions, uncertainty, quality checks, and owner's reasoning together. An inconclusive result is a legitimate outcome when the data cannot separate the possibilities that matter.
Use the worksheet to prepare one feasible comparison before adding more variants or metrics. Connect it to the priorities in your marketing plan, then assign the implementation and review. Better decisions can include keeping the current page, repairing tracking, or returning to customer research. The purpose is a clearer basis for action; an experiment does not guarantee a conversion gain, search ranking, or future result.
Sources and review notes
Reviewed against the linked primary sources on the checked dates. Search features and citations are selected by their respective platforms; no placement is guaranteed.
- Optimizely: A/B Testing — checked
- Statsig: Power Analysis — checked
- Statsig: Frequentist Sequential Testing — checked
- Microsoft PlayFab: Experiments Best Practices and Recommendations — checked
- Statsig: How to Read Experiment Results — checked
Frequently asked questions
What is A/B testing?
A/B testing is a randomized comparison of two versions of an experience against a predefined outcome. One group receives the current version and another receives the proposed version, with consistent assignment and measurement. The analysis estimates the difference and its uncertainty so the owner can decide whether the evidence supports changing the experience.
How much traffic do I need for an A/B test?
There is no universal visitor minimum. The requirement depends on the baseline, outcome variability, effect you need to detect, statistical settings, allocation, and assignment unit. Estimate it before launch using comparable historical data and your platform's method. Divide the required total by new eligible traffic to check feasibility, then allow time for the outcome window to complete.
How long should an A/B test run?
Plan enough time to reach the required sample, cover relevant business cycles, and observe the defined outcome window. A fixed-horizon test should follow its planned stopping rule. If you need early statistical decisions, configure a suitable sequential method before launch. Monitor safety and broken instrumentation throughout, and document any operational stop separately from a performance conclusion.
What does a 10% improvement mean in a test result?
Check whether the report means relative percent or percentage points. Increasing a rate from 5% to 5.5% is a 10% relative improvement and a 0.5-percentage-point increase. Include the underlying counts and the uncertainty interval. Those rates alone do not prove the variant is better, and a positive estimate can remain statistically inconclusive.
Can AI run my experiments and choose the winner?
AI can help organize supplied evidence, draft hypotheses, specify variants, and prepare a result summary. In Space Office, Fluorine and Oxygen support the experiment plan, with Hydrogen coordinating and reviewing. The responsible people still verify access, tracking, statistical assumptions, and business tradeoffs, and approve launch and rollout. No assistant can guarantee enough data, a significant result, or a business improvement.