Guide
What Is Data Analysis? A Worked Conversion Example
Follow a data analysis example from a reported signup decline to a channel-by-channel explanation you can recalculate.
By the Space Office team · Published · Updated · 16 min read
Data analysis is the process of preparing, inspecting, and interpreting data to answer a question. When a rate changes, start by verifying what counts in the numerator and denominator, then compare relevant groups. In this worked example, a language school’s overall signup rate falls while both channels improve. Fluorine can review the signup measurement in a scoped Space Office workflow, Carbon can test the event rules, and Hydrogen reviews the evidence for the human owner.

Key takeaways
- Write down the population, unit, outcome, and time window before comparing rates.
- Reconcile raw rows with the grouped totals and keep missing source labels visible.
- When group sizes differ, calculate the combined rate from total counts.
- Hold the group weights fixed to see how much of the observed change is associated with changes within groups.
- Use the result to choose a follow-up check. An observational breakdown can show where to look for causes.
What does data analysis answer?
Start with the decision behind the request. A school coordinator who asks why registrations fell may need to decide whether to change the website, investigate a new referral partner, or watch another reporting period. The initial question can be more precise. Did the percentage of eligible visitors who completed a first introductory class registration change between two comparable periods? That version names a population, outcome, and comparison. HHS Office of Research Integrity educational module on data analysis
Descriptive analysis summarizes what was recorded. Diagnostic analysis breaks the change into parts and checks plausible explanations. Predictive work asks what is likely to happen later and requires its own evaluation. An experiment asks what would change if the organization altered a policy or experience. In the language school example, grouping by acquisition source helps diagnose a historical change. For a separate forward-looking example, see the data science forecast guide.
Write down the first deliverable before exporting a large file. A coordinator may need two reconciled period totals, a breakdown by acquisition channel, a short note on incomplete records, and one concrete follow-up. That scope focuses the work on evidence that could change a decision and keeps sensitive details, such as a student’s name or contact information, out of a routine report.
Define the metric before opening the spreadsheet
The fictional school defines an eligible visitor as one distinct observed visitor ID whose first eligible class page visit in the cohort period occurred before any confirmed introductory registration. The numerator counts eligible visitors with at least one confirmed introductory registration within seven days of that visit. Each person represented by one observed ID contributes at most one success in the period. The example assumes an approved ID can connect visits with confirmations. A real dataset may measure browser IDs with partial coverage, so label the population accordingly.
Assign each visitor to the source on that first eligible visit, using one deterministic rule for ties. The example has only direct and referral traffic. Real data can have more sources and an unknown category. Keep unknown records visible while measuring their share. If you use Google Analytics, check whether a dimension is scoped to a user, session, or event before joining or comparing reports. The example’s cohort rule is its own definition. Google Analytics traffic-source dimension scopes
Wait until each period’s last eligible visitor has had the full seven days to complete a registration. A registration can occur after the calendar period in which the visitor entered the cohort. Attribute it to that cohort if it falls inside the outcome window. Comparing a fully observed old cohort with a recent cohort that has only two days of follow-up can manufacture a decline.

Check the rows and make the comparison reproducible
- 1Record the source systems, time zone, extraction date, cohort boundaries, outcome window, and event version. Save the criteria used to exclude tests or staff traffic.
- 2Check how often a visitor ID is missing, repeated, or linked to more than one channel in a cohort. Keep one eligible row per observed ID and period under the chosen rule.
- 3Reconcile confirmations with the approved registration record. Repeated browser events can describe the same confirmation. Use a durable registration reference where allowed and preserve the reason for excluding unmatched events.
- 4Count visitors who have no confirmation and keep them in the denominator. An inner join between visits and confirmations can silently remove every visitor who did not register.
- 5Check that grouped counts sum to both period totals. Investigate unexpected zeros, sources that disappeared, and large changes in unknown records before interpreting a difference.
A data quality rule is useful when it has a test and a consequence. If the share of missing source labels increases from 2 percent to 20 percent after a tagging change, a channel comparison may lose too much coverage to support the decision. Report the gap and examine raw samples with permission. Accuracy, completeness, uniqueness, and timeliness can fail independently, so test the dimensions that matter for the question. UK Government Data Quality Framework
Plot daily cohort sizes or review a day-by-day table before summarizing. A single spike may correspond to a legitimate newsletter mention, a burst of duplicate tracking, or a changed filter. Compare that day with the source records before excluding it. Exploratory checks can reveal outliers and assumptions worth investigating before you settle on a summary. NIST engineering statistics handbook on exploratory data analysis
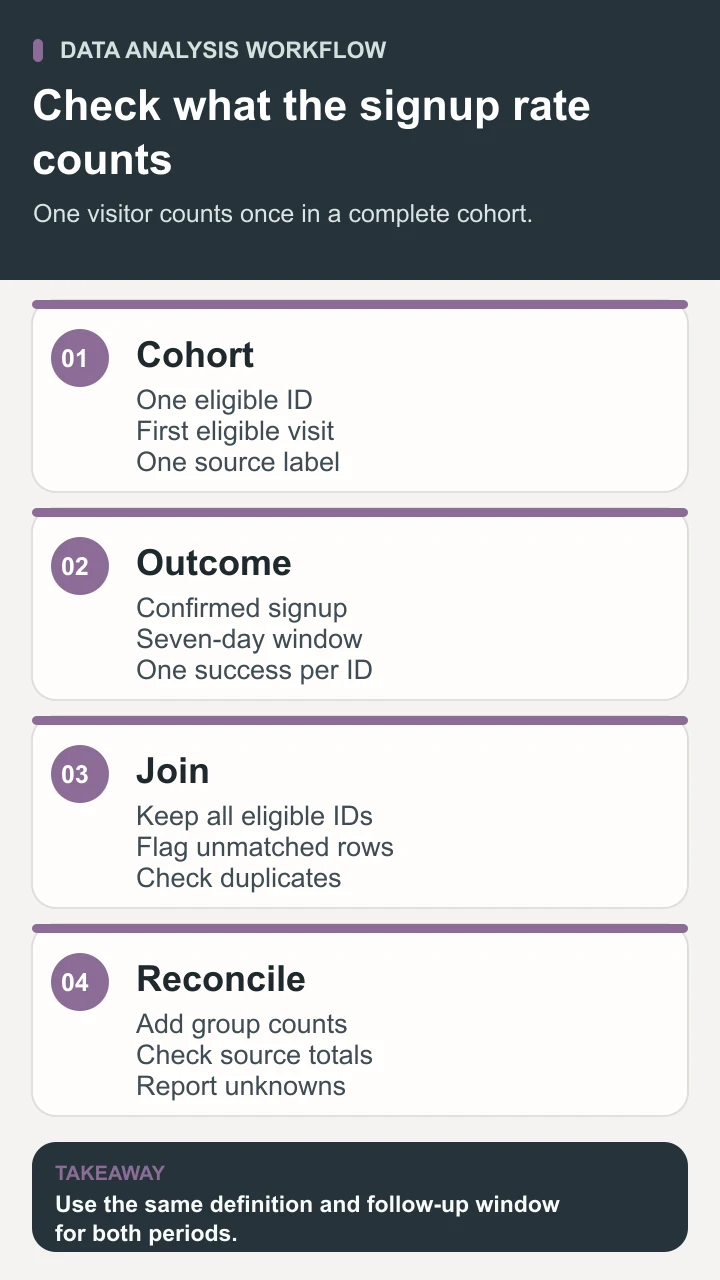
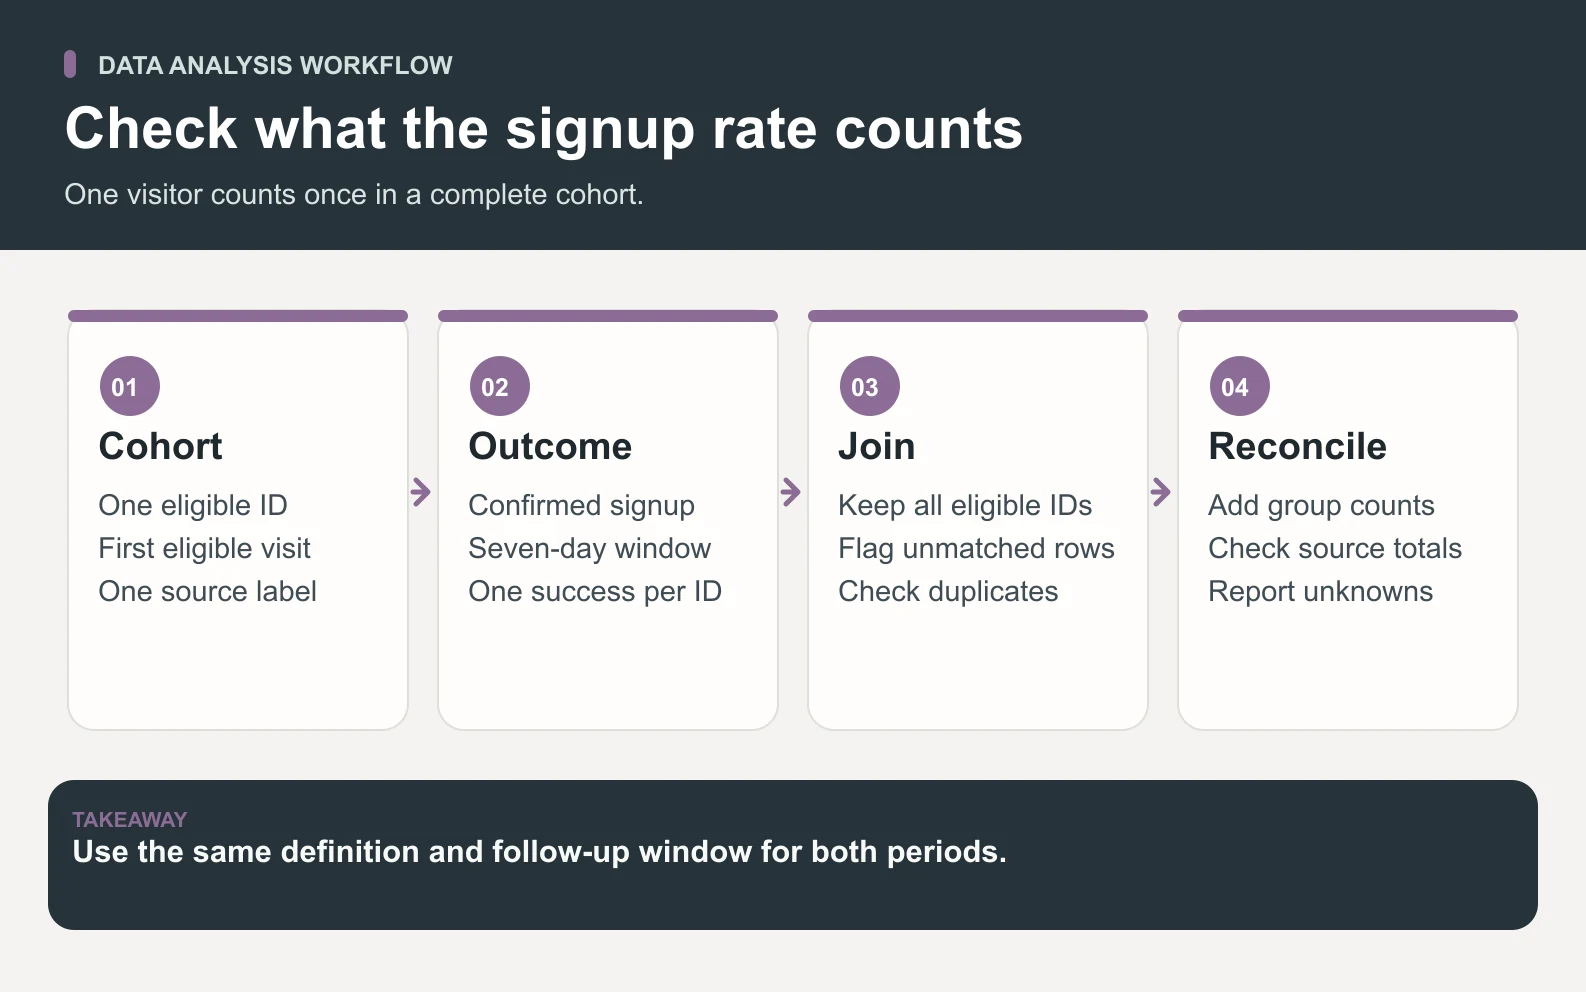
Make a small test fixture before trusting the export. One visitor who arrived via referral and later returned directly should keep the original referral label under the stated cohort rule. A visitor who generates two confirmation events for the same registration still counts once. A visitor without a confirmation remains in the denominator. A confirmation exactly seven days after the first visit needs a documented boundary rule. For this example, use an inclusive cutoff at seven elapsed days.
Use a separate population check before joining channels. Count unique eligible IDs in each period from the visitor records alone. After the join, count them again. If a one-to-many event table expands the number of rows, reduce it to one success flag per eligible visitor before aggregating. Compare how many confirmations have no matching eligible visitor and decide whether the result is usable. In a rate report, an unmatched confirmation and an eligible visitor without a confirmation describe different cases.
Work through the two-period conversion example
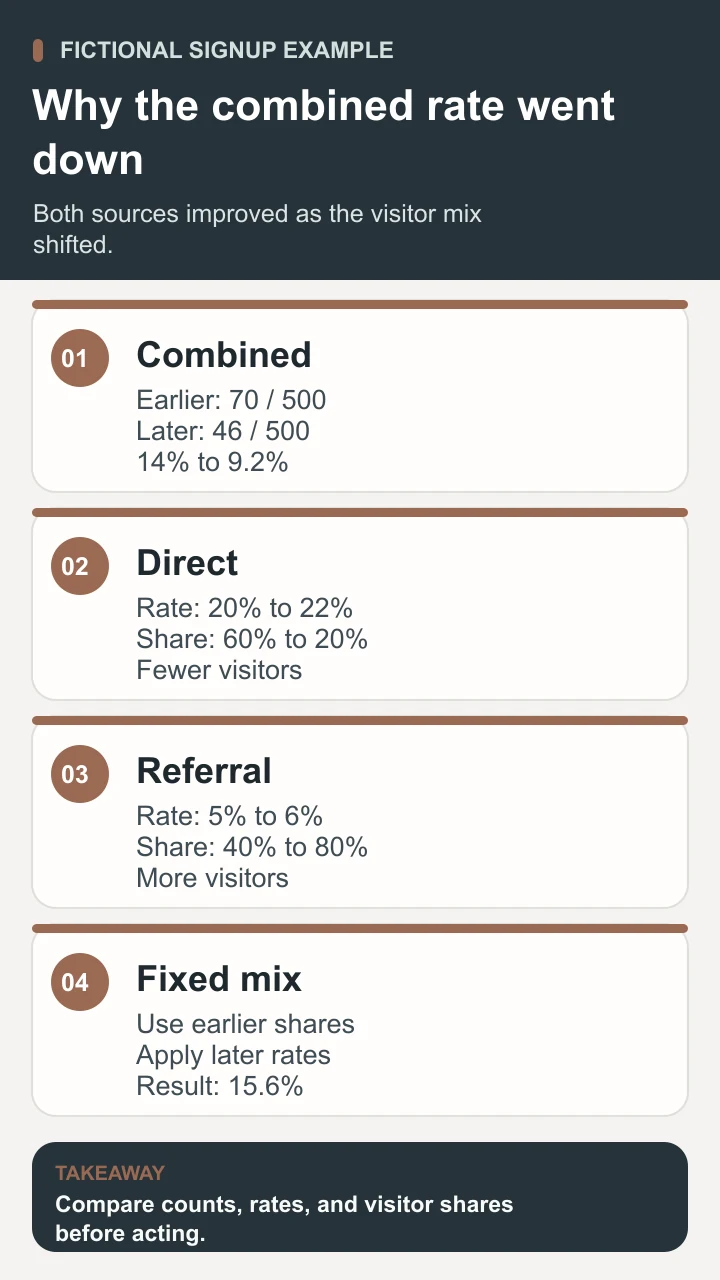
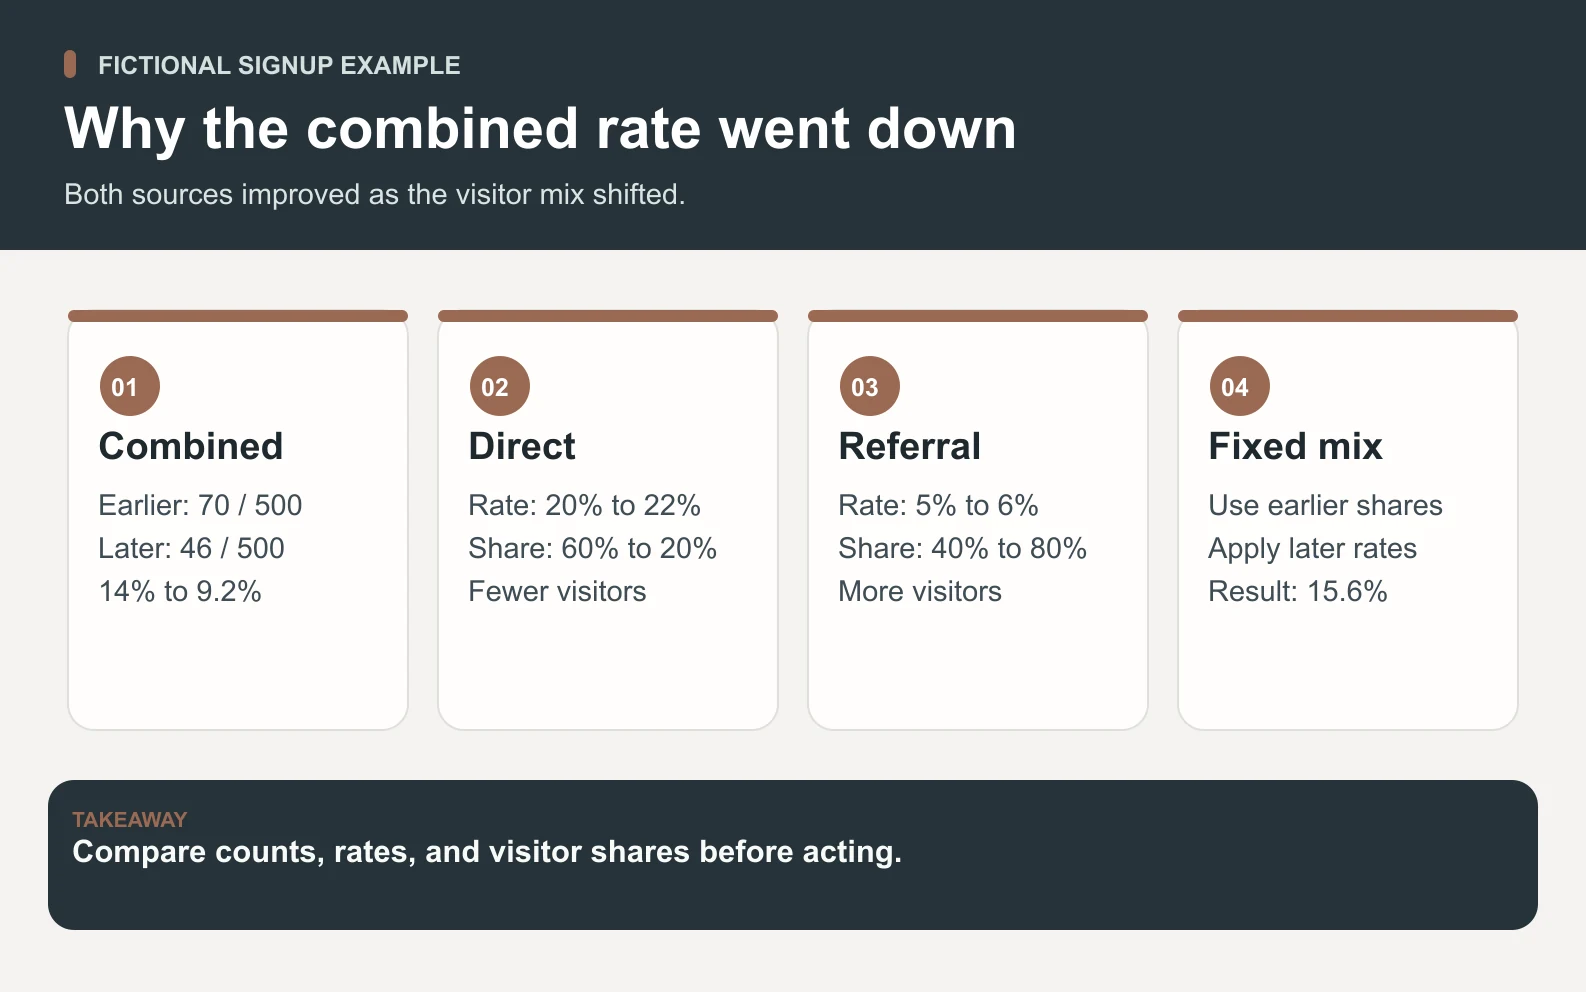
The school’s earlier period has 500 eligible visitors and 70 registrations. The later period also has 500 eligible visitors and has 46 registrations. The overall rate therefore moves from 70 ÷ 500 = 14% to 46 ÷ 500 = 9.2%. That is a fall of 4.8 percentage points and about 34.3% relative to the earlier rate. The table uses invented counts to show what can happen when the traffic mix shifts.
Scroll horizontally to view all columns.
| Period | Source | Eligible visitors | Registrations | Rate |
|---|---|---|---|---|
| Earlier | Direct | 300 | 60 | 20% |
| Earlier | Referral | 200 | 10 | 5% |
| Earlier | All | 500 | 70 | 14% |
| Later | Direct | 100 | 22 | 22% |
| Later | Referral | 400 | 24 | 6% |
| Later | All | 500 | 46 | 9.2% |
Direct improves by two percentage points and referral improves by one. The later period puts more weight on referral, whose observed rate remains lower. Earlier traffic is 60% direct and 40% referral. Later traffic is 20% direct and 80% referral. Because the visitor counts differ by source, averaging 22% and 6% would give an equal-weight rate of 14%, which answers a different question from the observed overall rate.
The count change helps explain the operational impact. Direct registrations fall by 38 as the direct audience shrinks, while referral registrations increase by 14. The sum is 24 fewer registrations. Both the total and the channel rates matter to the coordinator. A higher rate in a smaller audience can coexist with fewer registrations from that channel.

Hold the traffic mix fixed and interpret the result
Apply the later rates to the earlier visitor weights. The calculation is (0.60 × 22%) + (0.40 × 6%) = 15.6%. At the earlier mix, the later rates would have been 1.6 percentage points above the earlier observed rate of 14%. Moving from that fixed-mix result to the later observed rate of 9.2% accounts for a further 6.4 percentage points of decline. Together, +1.6 and −6.4 reproduce the observed −4.8 percentage points.
State the reference mix and calculation order when you report the breakdown. If you hold the later mix fixed and apply the earlier rates, you get (0.20 × 20%) + (0.80 × 5%) = 8%. From 14% to 8% is a six-point shift associated with the mix, and from 8% to 9.2% is a 1.2-point increase associated with the rates. Both paths reach the same total change. Their different allocations show why the reference needs to be visible.
A fixed-mix comparison is arithmetic. It does not show that sending a person through a referral would make them less likely to register. Referral visitors may be new to the school, prefer different courses, or arrive at different times. The comparison also does not establish that the increases from 20% to 22% and 5% to 6% will persist. Inspect counts, changes in measurement, and the uncertainty relevant to the decision.
Download the data analysis worksheet and recompute the counts and fixed-mix result before writing a recommendation. If you have several channels, keep the weight for each earlier group, multiply it by that group’s later rate, and sum the products. If a channel has no eligible visitors in one period, its rate is undefined. State how you handle that group and which population your adjusted comparison covers.
To reproduce the calculation, enter the four source rows in a spreadsheet with period, source, eligible visitors, and registrations. Add a rate column by dividing registrations by visitors in each row. Sum registrations and visitors separately for each period, then divide those two totals. For the fixed-mix column, multiply each later rate by the matching earlier visitor count divided by 500. Keep full precision in formulas and round only displayed results.
In the decision note, put counts next to the percentages and show both periods’ dates. A reader should be able to reproduce the change without opening a dashboard. Include an explanation of which records were excluded and whether the unknown-source share changed. If the groups are too small for a decision or measurement has changed, the useful next step may be gathering a complete cohort or repairing the collection rule before trying to improve the page.
Check whether the result survives a reasonable alternate definition that you can justify in advance. The coordinator might compare a seven-day window with a fourteen-day window if both cohorts have fourteen days of follow-up and class availability is comparable. If the direction changes, report both results and investigate the timing of registrations. A later signup can reflect a longer decision cycle. It can also reflect a class schedule that changed between periods. Keep the originally specified metric visible alongside the sensitivity check.
Turn the finding into a scoped Space Office review
The coordinator can investigate whether the source shift reflects a real referral change, a tag change, or missing records. Check the dates of partner mentions and compare the source classifications before and after any tagging update. If the decline affects a particular landing page or device, inspect the flow using the same outcome rule. Plan an A/B test if the decision eventually requires evidence about the effect of a page change.
In the Space Office workflow, give Hydrogen the metric definition, the two complete cohort windows, and an approved aggregate or de-identified export. Fluorine, the CRO Specialist, can review how the signup flow is measured and prepare a focused measurement check. Carbon, the Senior QA Engineer and Test Strategist, can test the confirmed-registration event and duplicate handling in an authorized test setup. Hydrogen reviews the specialist results against the definitions and identifies gaps for the human owner.
The owner verifies whether the source data covers the intended audience, decides whether to change tracking or investigate the referral mix, and approves any action in the analytics account. Provide only the rows and test access the review needs. For a workbook-only review, the aggregate example and metric specification are enough. The live roster describes the scope of the specialists.
Summarize the change and the evidence behind it
Useful data analysis leaves the coordinator with a result they can audit and a next question they can answer. Here, the overall rate fell from 14% to 9.2% as more visitors came from the lower-converting source, even though both source rates rose in the fictional data. Verify that the channel labels and cohort counts are comparable, and check what changed in the visitor mix before changing the signup page.
Sources and review notes
Reviewed against the linked primary sources on the checked dates. Search features and citations are selected by their respective platforms; no placement is guaranteed.
Frequently asked questions
What is data analysis?
Data analysis is the process of inspecting, preparing, and interpreting data to answer a defined question. It can include checking whether records are complete, calculating metrics, comparing groups, and documenting what the evidence supports. A good result states the population, time window, and limits.
Can the overall conversion rate fall if every channel improves?
Yes. The overall rate weights each channel by its share of eligible visitors. A shift toward a channel with a lower rate can outweigh improvements within each channel. Compare the actual totals, the channel counts, and the rates at a fixed mix.
What is a percentage-point change?
A percentage-point change is the arithmetic difference between two percentages. A fall from 14% to 9.2% is 4.8 percentage points. Relative to the starting rate, the fall is about 34.3%. State which measure you are reporting.
What if the data sources disagree?
Compare their date windows, identity scope, counting rules, and event timing. Reconcile a small approved sample against the record that proves the outcome. Record any unmatched or missing rows and explain how they affect the conclusion before deciding which source to use.
Can this analysis show what caused a decline?
It can locate a change and show how the overall rate depends on rates and traffic shares. A causal claim needs evidence that addresses other explanations. A carefully designed experiment can help assess whether a proposed change affects the outcome.